KPI dashboard
Last updated: 2026-05-07
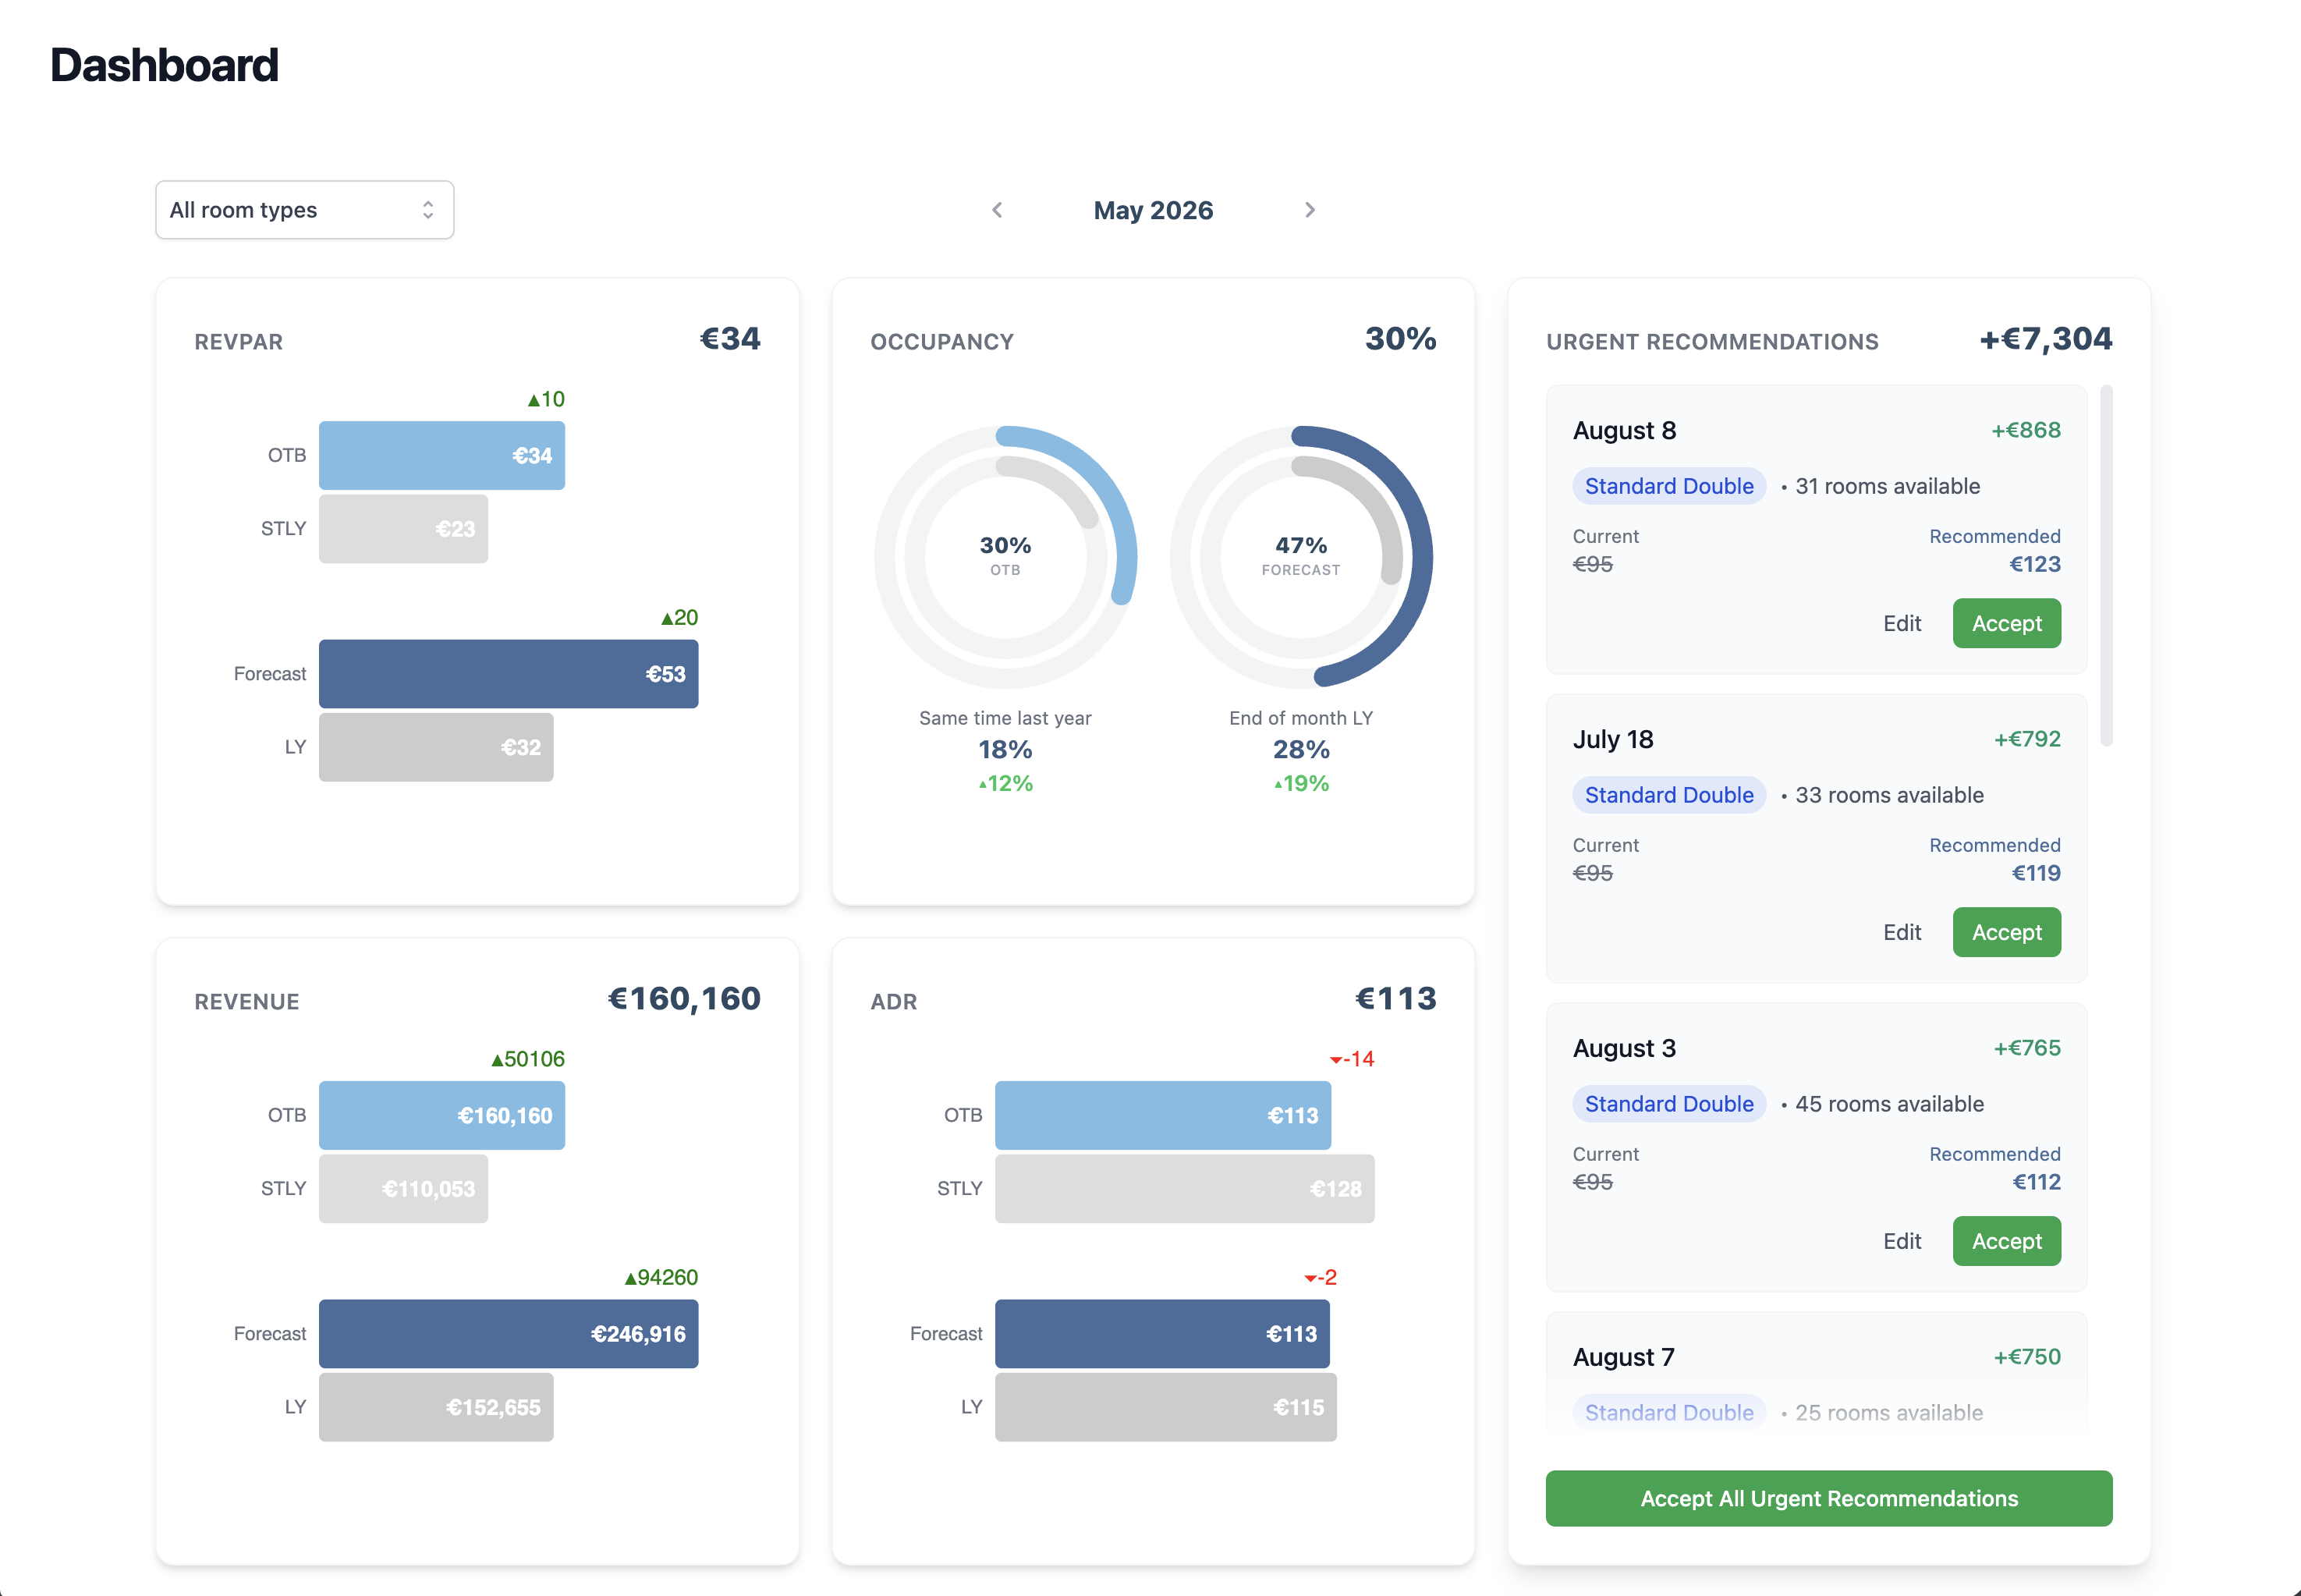
The KPI dashboard is your revenue cockpit. It shows the four metrics that matter most — RevPAR, ADR, occupancy, and revenue — alongside the Pace Report, Pick Up, and a panel of urgent price recommendations. The default view shows the current month across all room types.
The four core metrics
RevPAR
Revenue per available room — total room revenue divided by available rooms. It's the single best summary of how well you're filling and pricing rooms. See the glossary entry for RevPAR.
ADR
Average daily rate — room revenue divided by rooms sold. ADR rising while occupancy holds steady is the cleanest signal that pricing has room to climb. See ADR.
Occupancy
Rooms sold divided by rooms available, expressed as a percentage. The occupancy card shows two ring gauges: on-the-books (OTB) occupancy versus the same point last year, and forecasted end-of-month occupancy versus last year's final figure. Useful in isolation, but always read it alongside ADR — high occupancy at a low rate means you've under-priced. See occupancy rate.
Revenue
The sum of room revenue for the selected period. Everything else on the dashboard is context for why this number is what it is.
Charts on the dashboard
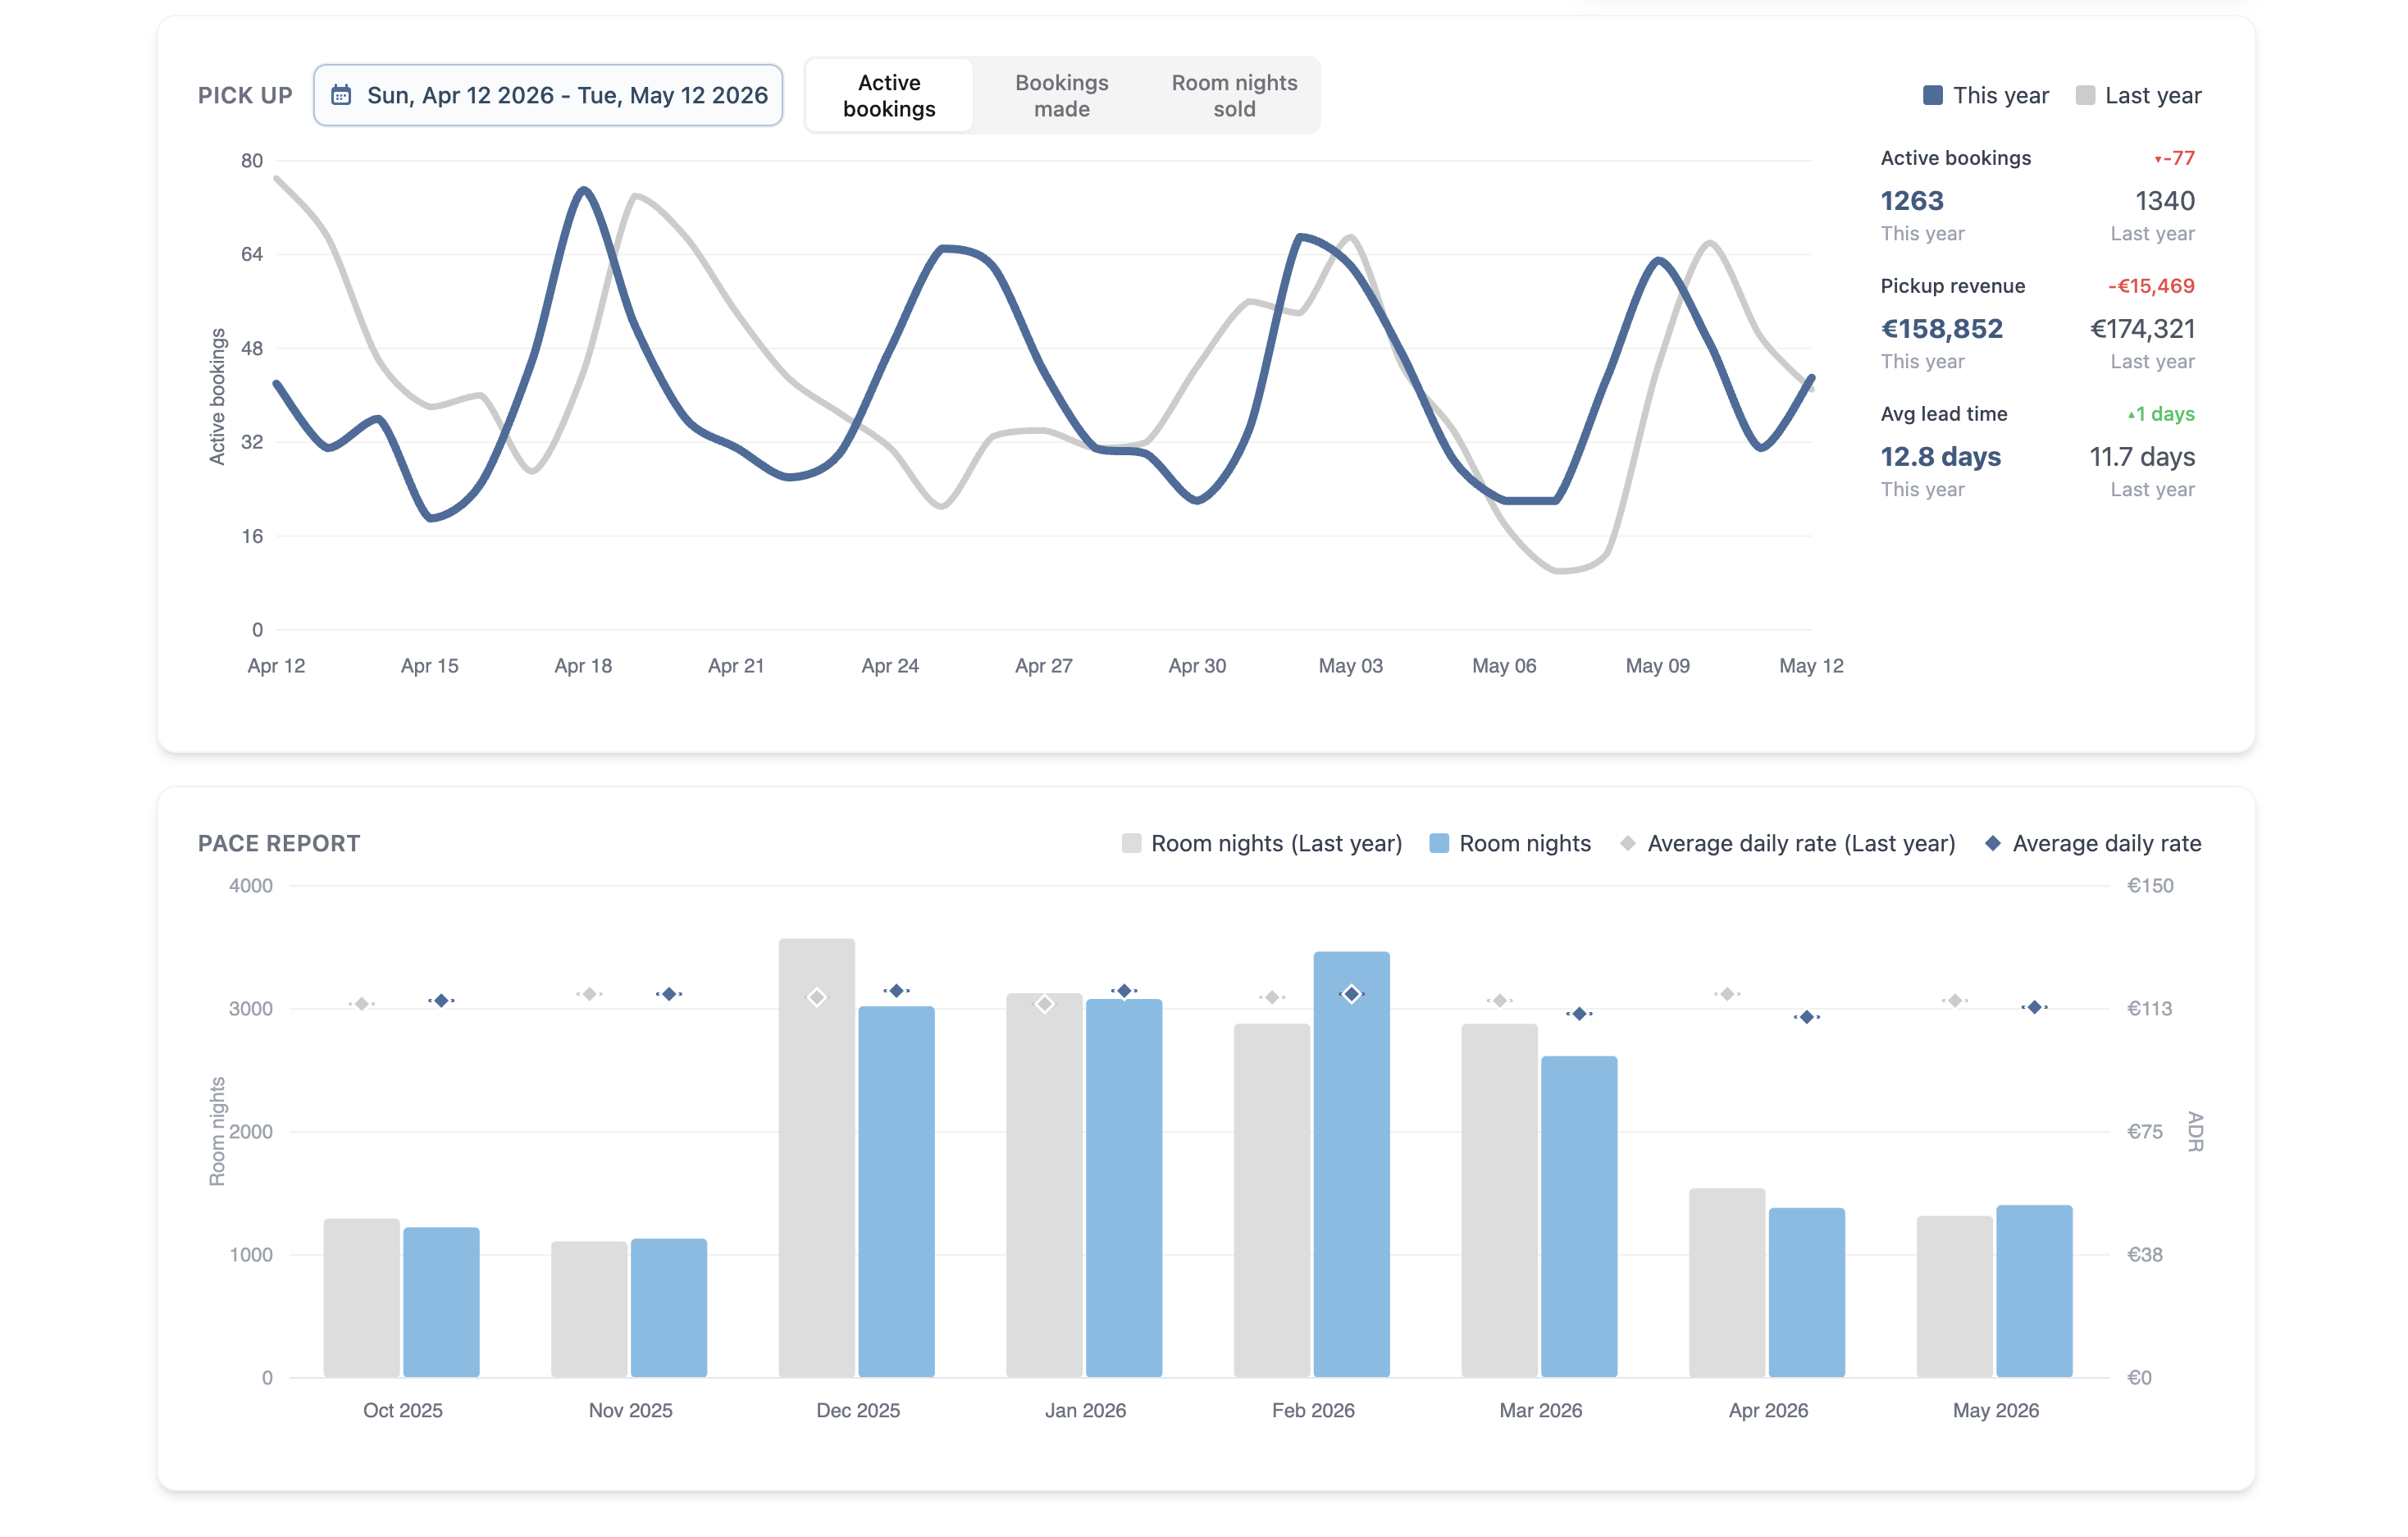
Pace Report — monthly room nights on the books versus the same months last year, with ADR overlaid as diamond markers. Falling pace is your earliest warning that demand is soft. See Pace Report for the deep dive.
Pick Up — how many net new bookings and room nights came in each day, compared to the same period last year. See Pick Up.
Urgent Recommendations — the upcoming dates with the highest revenue opportunity. You can accept a recommendation directly from the dashboard without opening the full calendar view.
Filtering
The month picker at the top of the page switches between months — the metrics cards and occupancy gauge update to show the selected month. The room-type selector narrows everything on the dashboard to a single room type — useful when one type behaves very differently from the rest of the portfolio.
Daily fluctuation versus signal
A single off-pace day is usually noise — pickup is naturally lumpy. Look for two or three consecutive days trending the same direction before adjusting strategy. Pace deviations of more than 10% sustained over a week are a stronger signal.
Related articles
- Pick UpTrack how many net new bookings come in each day and how that compares to the same day last year.
- Pace ReportCompare your booking pace toward future arrival dates against the same period last year.
- Occupancy chartRead the occupancy curve, see what's already booked, and spot soft dates.
- Demand forecastingSee projected demand by date range and how Sigma Revenue's forecast informs price recommendations.